 |
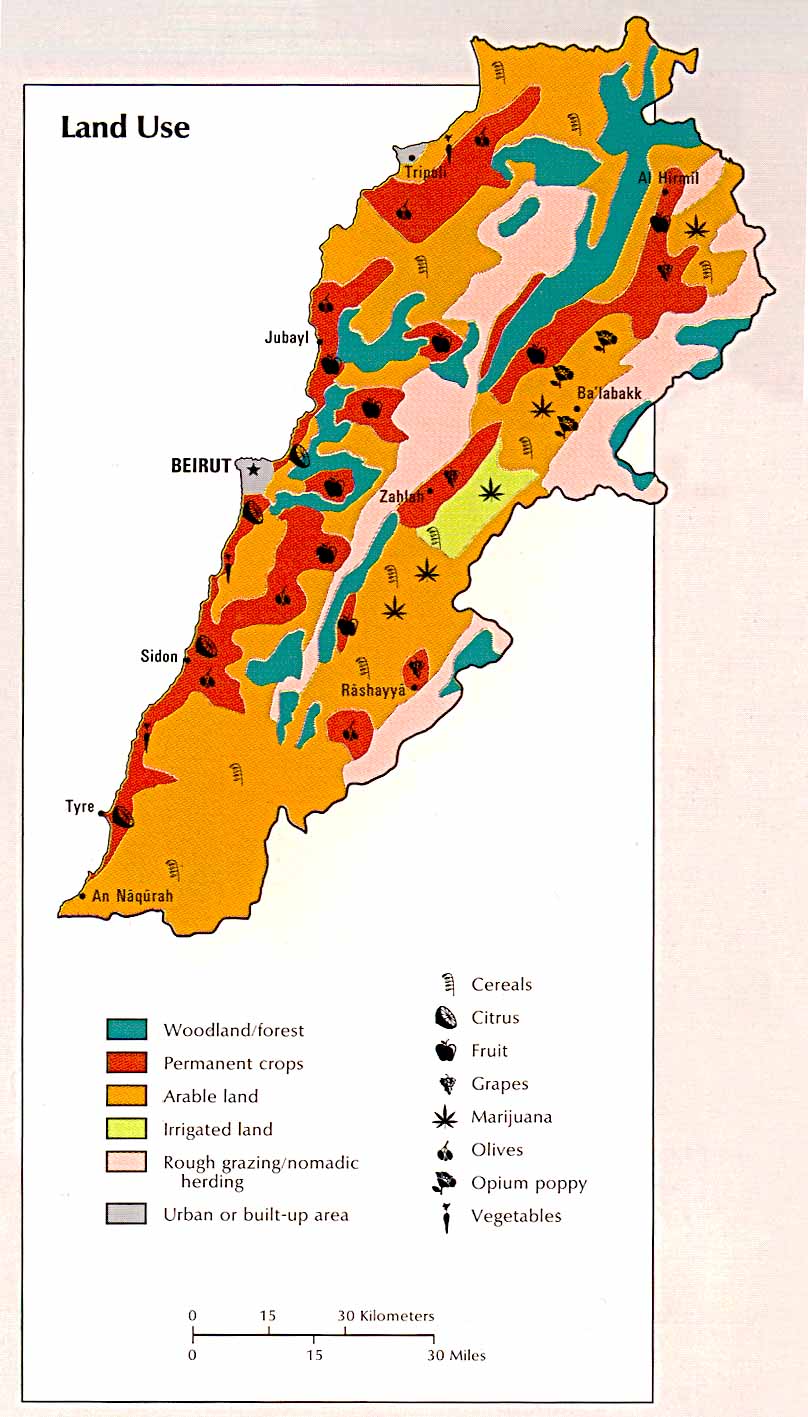
| Land Use. 1993. Photograph. Leb Guide, Beirut. Web. 2 Oct 2012. <http://www.lebguide.com/lebanon/images/maps/lebanon_land.jpg>. |
The first map I chose was of Lebanon's land use. I'm originally from Lebanon and I have seen pictures in the past of when my parents used to live there with trees and green everywhere. Unfortunately, most trees are found in sanctuaries which aren't funded and taken care as much as they should. The pollution is on the rise as well since many trees have been cut. I found this map on: http://www.lebguide.com and it was from the Atlas of the Middle East 1993. The map shows the land use in Lebanon and what stands out is the orange which is arable land. Also there is a small strip of irrigated land while the rest is land for permanent crops and some woodland/forest. I also liked that the map identified where certain crops tend to grow in relation to their region and geographic location. What I found interesting is the ratio of arable lands to woodland/forests which is the first thing that stood out to me when I first saw the map. The map was done in 1993 and unfortunately many more woodlands have been cut down due to construction and urbanization.
 |
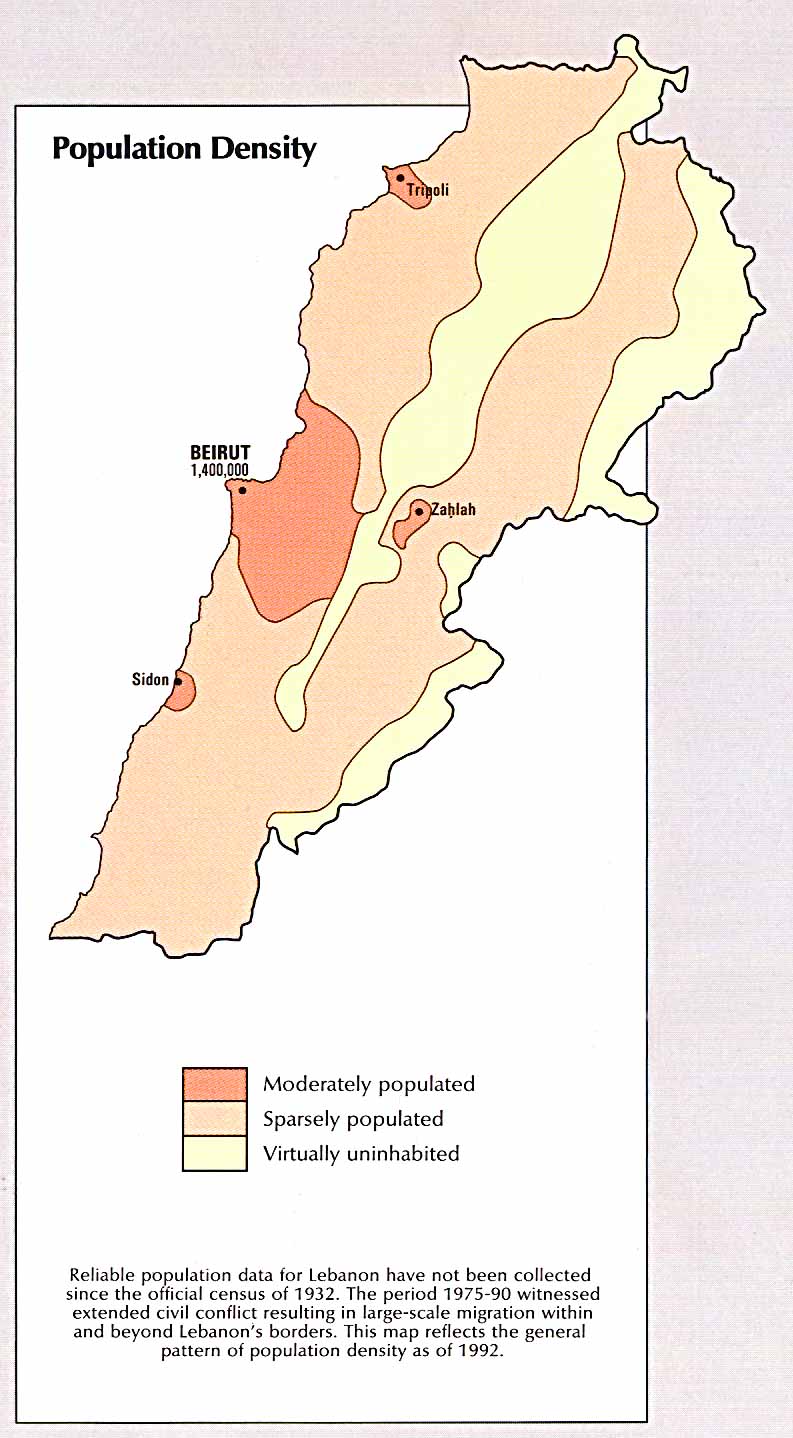
| Population Density. 1993. Map. Leb Guide, Beirut. Web. 2 Oct 2012. <http://www.lebguide.com/lebanon/images/maps/lebanon_pop.jpg>. |
The second map I chose,
Population Density, was from the same website, http://www.lebguide.com, and it was from the Atlas of the Middle East 1993. I chose this map to compare and contrast the reasons why certain woodlands/forests were located where they were identified on the map. Also I wanted to see what was located around densely populated areas such as Beirut, the capital of Lebanon. Beirut is shown on the
Land Use map as "urban/built-up", therefore the land is not used. In this map, Beirut and its surrounding neighborhoods are "moderately populated" with a population of 1.4 million. What I found interesting is three other smaller densely cities surrounding Beirut while Beirut remains the center. I also found interesting that the surrounding "moderately populated" cities still made use of their land unlike Beirut. For example, Sidon uses its land for growing citrus and olives and they are known for making olive oil which I was able to taste. In Zahlah, they use their land for growing grapes and are known for making wine and many winery's can be found. Overall, I was able to have a better understanding of the correlation between land use and population density in Lebanon.
 |
| Map of Los Angeles.
2004. Photograph. Golden Horizon Travel, San Francisco. Web. 2 Oct
2012.
<http://www.goldenhorizontravel.com/photos/california-tour-map.gif>. | | | | | |
The last map I chose was of Los Angeles in where I was born and raised and I this map stood out to me when I was searching because of how animated it was. Although it's animated and created by a travel agency, it's distorted and makes all the attractions seem so close to one another. For example, a car ride from Los Angeles to Las Vegas takes about 5 hours. I think the travel agency achieved their goal of making all the attractions appealing but may upset some people when they realize how far everything is from one another. The map also shows all the nice things and attractions of California and Nevada with icons although the map is titled
Map of Los Angeles. What I found interesting is how close the travel agency made the attractions seem to one another and how other attractions such as the Griffith Observatory or Huntington Beach Botanical Garden aren't located.

No comments:
Post a Comment